A Supervisor's Guide to Process Charts
Every good supervisor always seeks to improve the work methods of his unit. The WORK SIMPLIFICATION PROGRAM is designed to furnish such supervisors with handy, clear blueprints of the present working methods of their own units. Analysis of the facts on these blueprints will help eliminate bottlenecks and lost effort and make supervisory work easier. WORK SIMPLIFICATION is a tested program for improving the method of doing work — finding a “better way” — doing a better job with less effort and in less time.
The Process Chart
Second Step In Work Simplification
The Work Distribution Chart points the way and gives you “clues” for further study by showing you where the bulk of the work in your unit is done. It tells you the number of employes and the number of manhours required for each activity.
But the PROCESS CHART gets right into the heart of these figures because it shows you HOW each activity is carried out. It lays out for you in clear, concise steps the work of your office. And that’s important for this reason: The mind can only think about a few things at a time. In order to analyze a complete process, it must be put down detail-by-detail in the order in which it happens. Then you can think about it clearly and intelligently, analyze it and study it, go over it again and again.
THE PROCESS CHART shows you the “who”, “how” and “when” of a whole work process and permits you to ask “why” about every step. And only by asking what is the purpose of every step can you find ways of simplifying procedure, getting rid of bottlenecks in your unit and smoothing out rough spots.
And Here’s A Word of Comfort:
Process charting may look mysterious; the symbols may puzzle you for a moment. But don’t be fooled! Process charting is easy — and it’s fun, too, once you get the hang of it.
Four Keys To Process Charting
The first job in process charting is to identify each step in a process or activity. And that is not hard if you just remember this: Every office paper has something done to it.
Take an application for instance. First, it can remain where it is—“stay put” in other words. During this time, we say it’s in “storage,” no matter whether it’s resting in an “outgoing” basket or in a pending file. Second, someone can move it to another spot—from desk to desk or from office to office. This is called a “transportation.” Third, someone can look at it—examine it—check it for accuracy or completeness. An “inspection” in other words. Fourth, and finally, the application can have something done to it. It can be filled out, or signed or approved or filed. This is called an “operation.”
Process charting identifies these four actions, lists them, makes them come to life—and gives you the chance to eliminate, combine, rearrange and simplify.
Sign Language
To help you see at a glance just what steps are taking place during a work process, four simple symbols are used for the four actions of “storage,” “transportation,” “inspection” and “operation.” They are the sign language of process charting.
◯ — OPERATION
When something is being changed, or created, or added to, you use a large circle to show that an action or “operation” is taking place. (Typing a letter.)
○ — TRANSPORTATION
When something is moved from one place to another, you use a small circle to show “transportation.” (A letter carried to another desk.)
△ — STORAGE
When something remains in one place waiting further action, you use a triangle to show “storage.” (A letter in an “outgoing” box, for example.)
□ — INSPECTION
When something is checked or verified but not changed, you use a square to denote an “inspection.” (Proofreading a letter, for example.)
Filling Out A Chart
To help you in process charting, a standard Work Simplification Process Chart with the four symbols repeated on each line has been provided.
In writing down a process, simply mark the proper symbol for the step and draw connecting lines between the symbols as you describe each step.
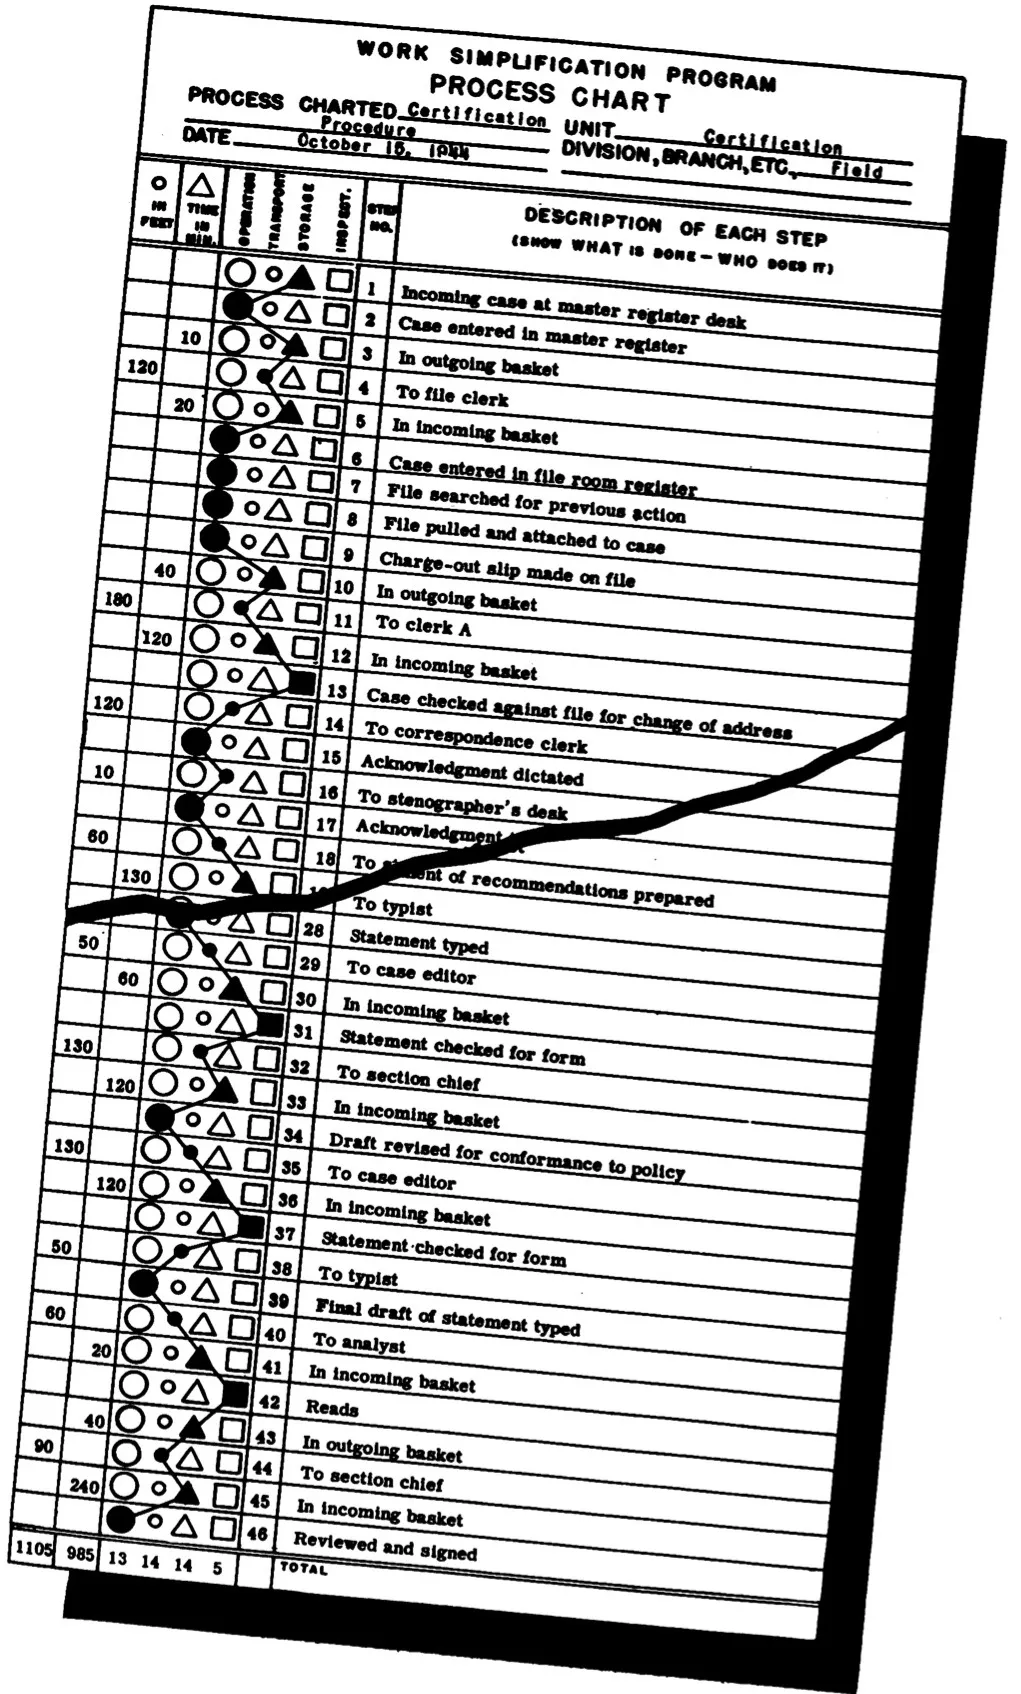
The four symbols are merely a guide. The actual description of the step should be written in on the space provided. It is important that you tell what is done and who does it. Be clear and be specific. Make sure that what you write identifies and describes the step clearly. Do not write “application checked” if you mean “application 127A checked for change of address.”
There are two other columns on your process chart. In one, note the time in minutes things remain in “storage” and in the other write the distance in feet something moves during a “transportation.” Rough estimates are enough.
How To Begin
-
Decide on the activity you want to chart. Then stick with it. Do not allow yourself to be sidetracked.
-
Pick a starting point and an ending point. Cover the ground and no more. Follow one piece of paper throughout.
-
Identify each step; number it. Then apply the proper symbol and connect it with the preceding one.
-
Describe each step, even though it may be minor. Never omit a step when in doubt.
-
Enter time for storage and distance in feet for transportations.
-
Add it all up. Add up the number of “storages,” “transportations,” “inspections” and “operations,” the total time of storages, and the distances in feet for each process.
The Finished Job
When you have finished your process chart, it should look like the one on the opposite page. Of course, you followed the process step by step thru your unit asking questions and taking notes as you went along. But check back; make sure you have included every step; and that you know what is happening at every step.
How To Analyze A Process Chart
Remember, you are looking for ways to eliminate, combine, rearrange and simplify steps. For that reason, question each detail of the process. Ask yourself what purpose each one serves. So ask yourself these questions:
WHAT
is done? What are the steps? Do I have them all? What does each step do? What are the surrounding facts?
WHY
is this step necessary? Can as good a result be obtained without it? Is it an absolute must? Don’t be misled by an excuse when you are looking for a reason.
WHERE
should this step be done? Can it be done easier—with less time and transportation—by changing the location of employees or equipment?
WHEN
should this step be done? Is it done in the right sequence? Can I combine or simplify by moving this step ahead or back?
WHO
should do the job? Is the right person handling it? Or is it more logical to give it to someone else?
HOW
is the job being done? Can it be done better with different equipment or different layout? Can I make the job easier for everyone concerned?
Work Simplification Program Process Chart
The next two pages show you how supervisors asked these questions and got results.
Work Simplification Program: Process Chart Analysis
What is Done?
What are the steps?
Do I have them all?
What does each step do?
The supervisor used this question to check his work. He realized that unless he had complete information about the process he was studying his conclusions would not stand up. Therefore he used this question to make sure that he had recorded every step and all the facts about each step.
Why Is The Step Necessary?
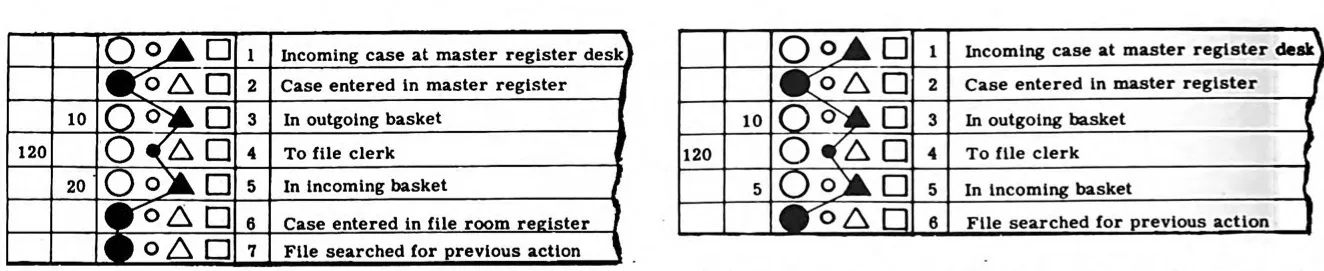 Why are two registrations necessary? By looking at the facts, the supervisor found that one was enough. Result: One step cut out — paper work and record keeping reduced. Here the supervisor asked “why” and found a better, simpler method.
Where Should This Step Be Done?
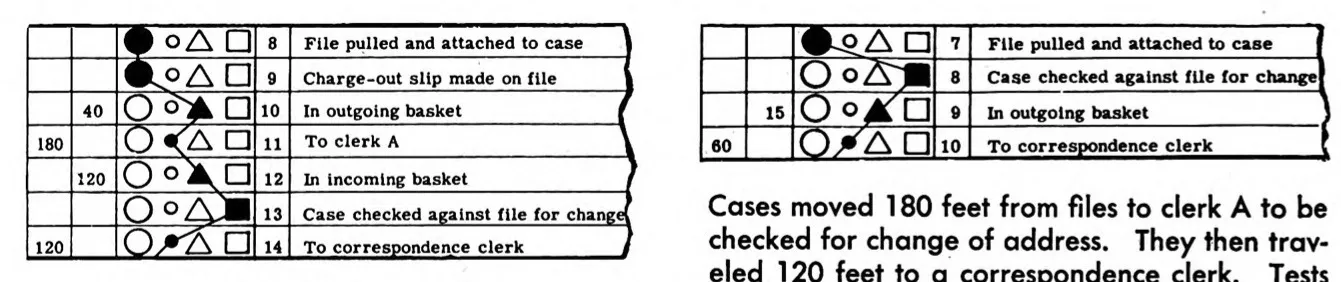 Cases moved 180 feet from files to clerk A to be checked for change of address. They then traveled 120 feet to a correspondence clerk. Tests proved that the file clerk could do the checking while pulling the file. As a result, charge-out slips were cut out, nearly 300 feet saved, and clerk A relieved of an unrelated task.
Process Chart Analysis (CONTINUED)
When Should This Step Be Done?
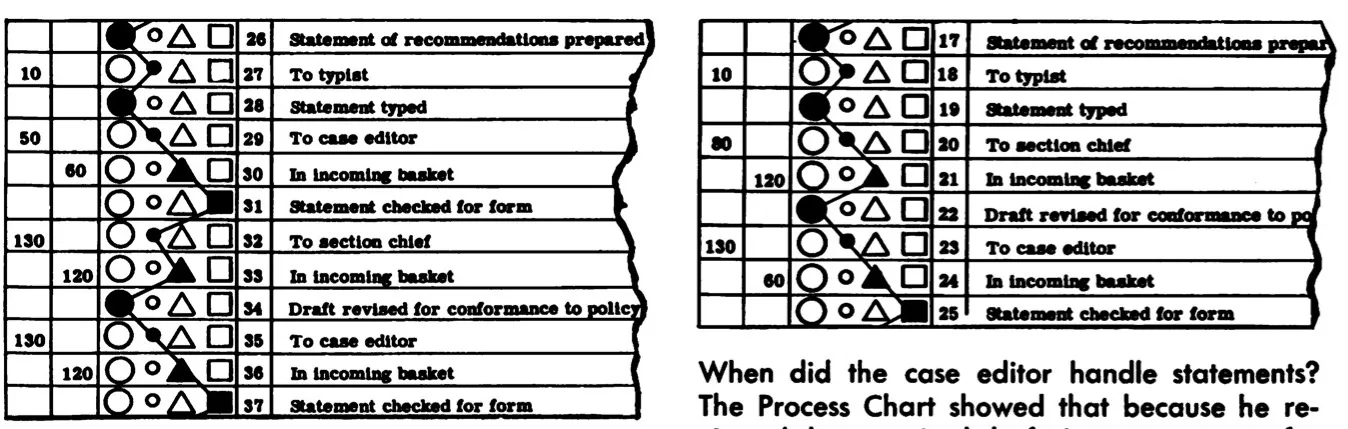 When did the case editor handle statements? The Process Chart showed that because he reviewed the unrevised draft, it was necessary for him to review it again after it had left the section chief’s desk. By looking at the sequence and asking “When” the supervisor cut out three unnecessary steps and did away with a bottleneck.
Who Should Do The Job?
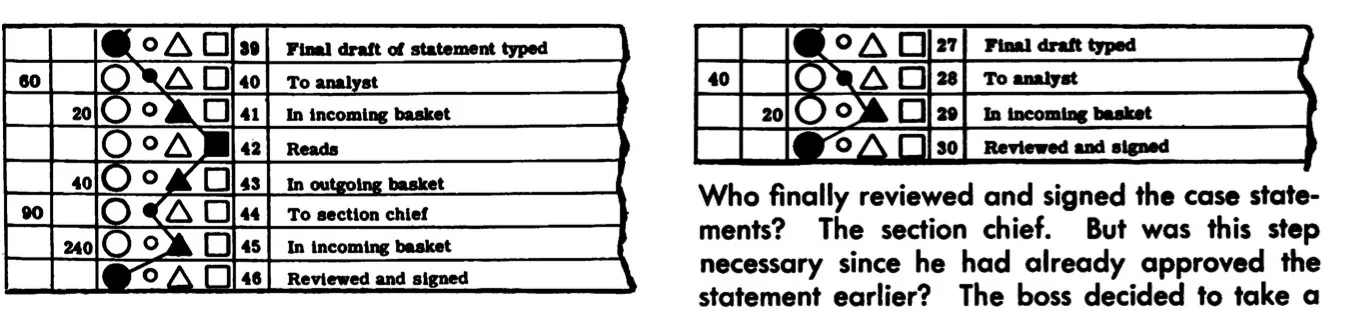 Who finally reviewed and signed the case statements? The section chief. But was this step necessary since he had already approved the statement earlier? The boss decided to take a chance and delegate authority to the analyst. He found that it worked. Result: Five hours, many feet of transportation and four steps in the process changed. Moral: Don’t pile controls too high; take a calculated risk. It may pay!
How Should This Job Be Done?
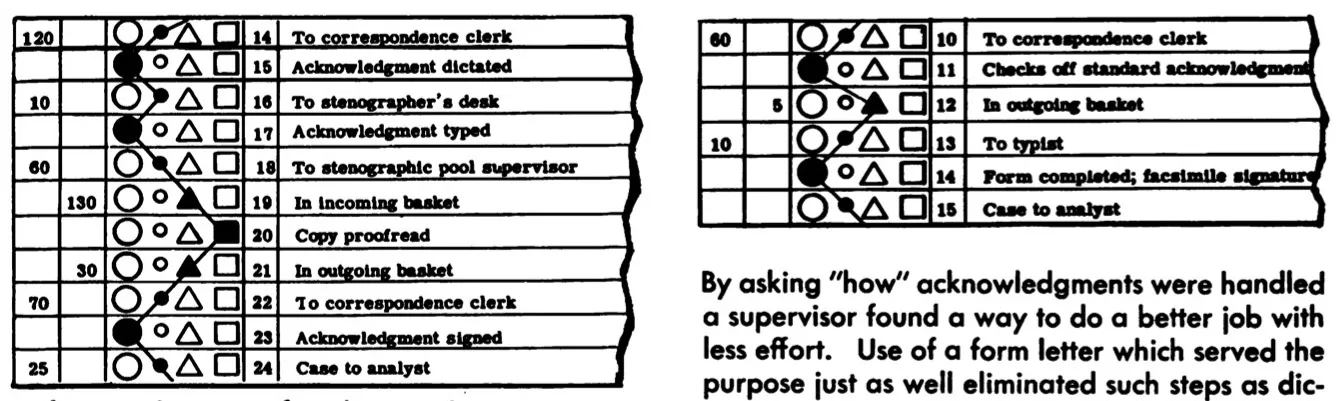 By asking “how” acknowledgments were handled a supervisor found a way to do a better job with less effort. Use of a form letter which served the purpose just as well eliminated such steps as dictating, typing, proofreading and signing. At the same time he cut transportation from 285 to 70 feet — storages from 160 to 5 minutes. Do it the easy way. Make use of mechanical devices.
Changing Findings Into Action
Study of your completed process chart has given you ideas on improvements in work methods. How do you go about installing these changes?
First, write up the new, better method in understandable form on a Process Chart so that everyone concerned can see just how you expect the job to be done.
But be sure you have ALL the facts. For that reason it is best to write down the proposed method and then wait until you have made your work count, the next step in Work Simplification. The work count will give you additional information to help you make sound decisions. It may show you how to make additional savings all along the line.
When you have made your work count, you will then be in a position to review your proposed changes carefully. Before making them, however, be sure that they are actually simplifications. Take them to your superior, if you think it necessary. Go over them carefully with him. Present your plan in such a clear, concise manner that there can be no doubt as to its benefit. Show him the “before” and “after” process charts you have prepared. Such conferences often bring to light other problems.
A TEST OR A TRIAL RUN OF THE METHOD WILL ALSO AID IN FURTHER REFINEMENT AND PROVE WHETHER OR NOT THE NEW METHOD WILL WORK.
Follow Through
Process charting is not a “one-shot” operation to be forgotten after you use it once. It is just as good for your unit six months or a year from now as it is today. So keep the Process Charts you prepare. They give you a record to which you can refer from time to time when further improvements are considered. And you can always make improvements—that’s progress.
The need for a new process charting of your unit at certain times is obvious. For example, whenever there is a large turnover in personnel, a change in the volume of work, or a major modification of your program.
But even without the excuse of one of these specific occasions, you will find that an annual or semi-annual blueprint of your unit via the process chart method will pay off in terms of doing a better job with less effort in less time.